
Somewhere in your customer database, two groups are hiding. One is a small minority who will buy from you three, five, ten times. The other is the overwhelming majority who will never make a second purchase. You paid the same amount to acquire both. One group is putting you in debt. The other is carrying your company.
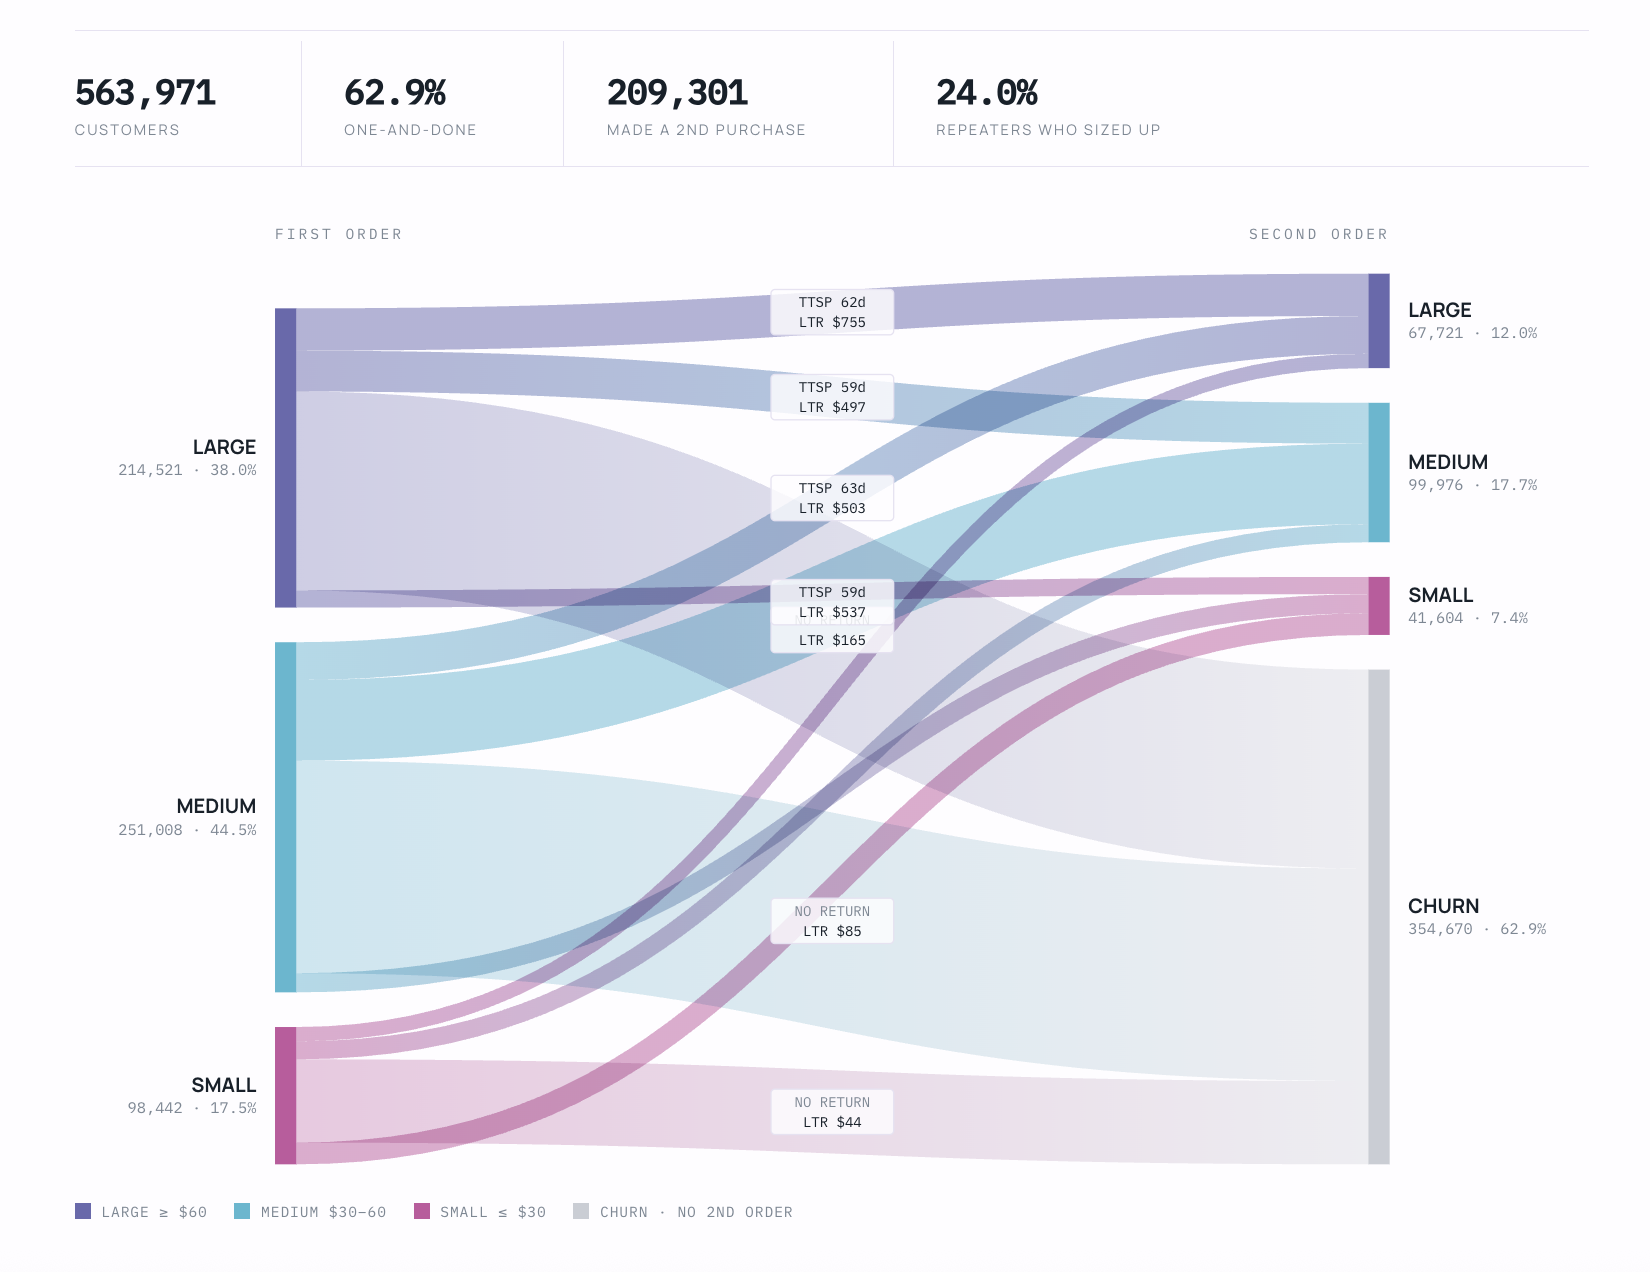
LTV:CAC is how elite brands tell them apart. The problem is that most brands cannot calculate it. Tools like Daasity, Triple Whale and Polar Analytics compress high and low spenders into a single average, ignore margins and seasonality, and lock their LTV definitions. So the CFO loses visibility into unit economics, the COO can’t prioritize acquisition versus retention, and marketing spend gets set from last year’s number.
At Latticework we have been doing LTV:CAC consulting for some of the best retail brands. We reconnect data from Meta, Google, TikTok, Shopify, Amazon and Salesforce in data warehouses like Snowflake and build the LTV:CAC models on top of it. In an LTV:CAC consulting engagement we deliver:
- LTV cohorts by acquisition month, so you can see how Black Friday customers differ from Memorial Day customers and how each cohort generates revenue over time
- CAC payback by channel, so you can see clearly how many orders it takes for a customer to pay for their own acquisition costs
- Contribution margin per order and per cohort, so your LTV numbers reflect what you’re actually keeping
- Predicted LTV on a per customer basis, using models like Buy Till You Die on your own transaction history
- The LTV:CAC ratio itself, by cohort and by season, with the definitions written down so finance, marketing and operations agree on one number
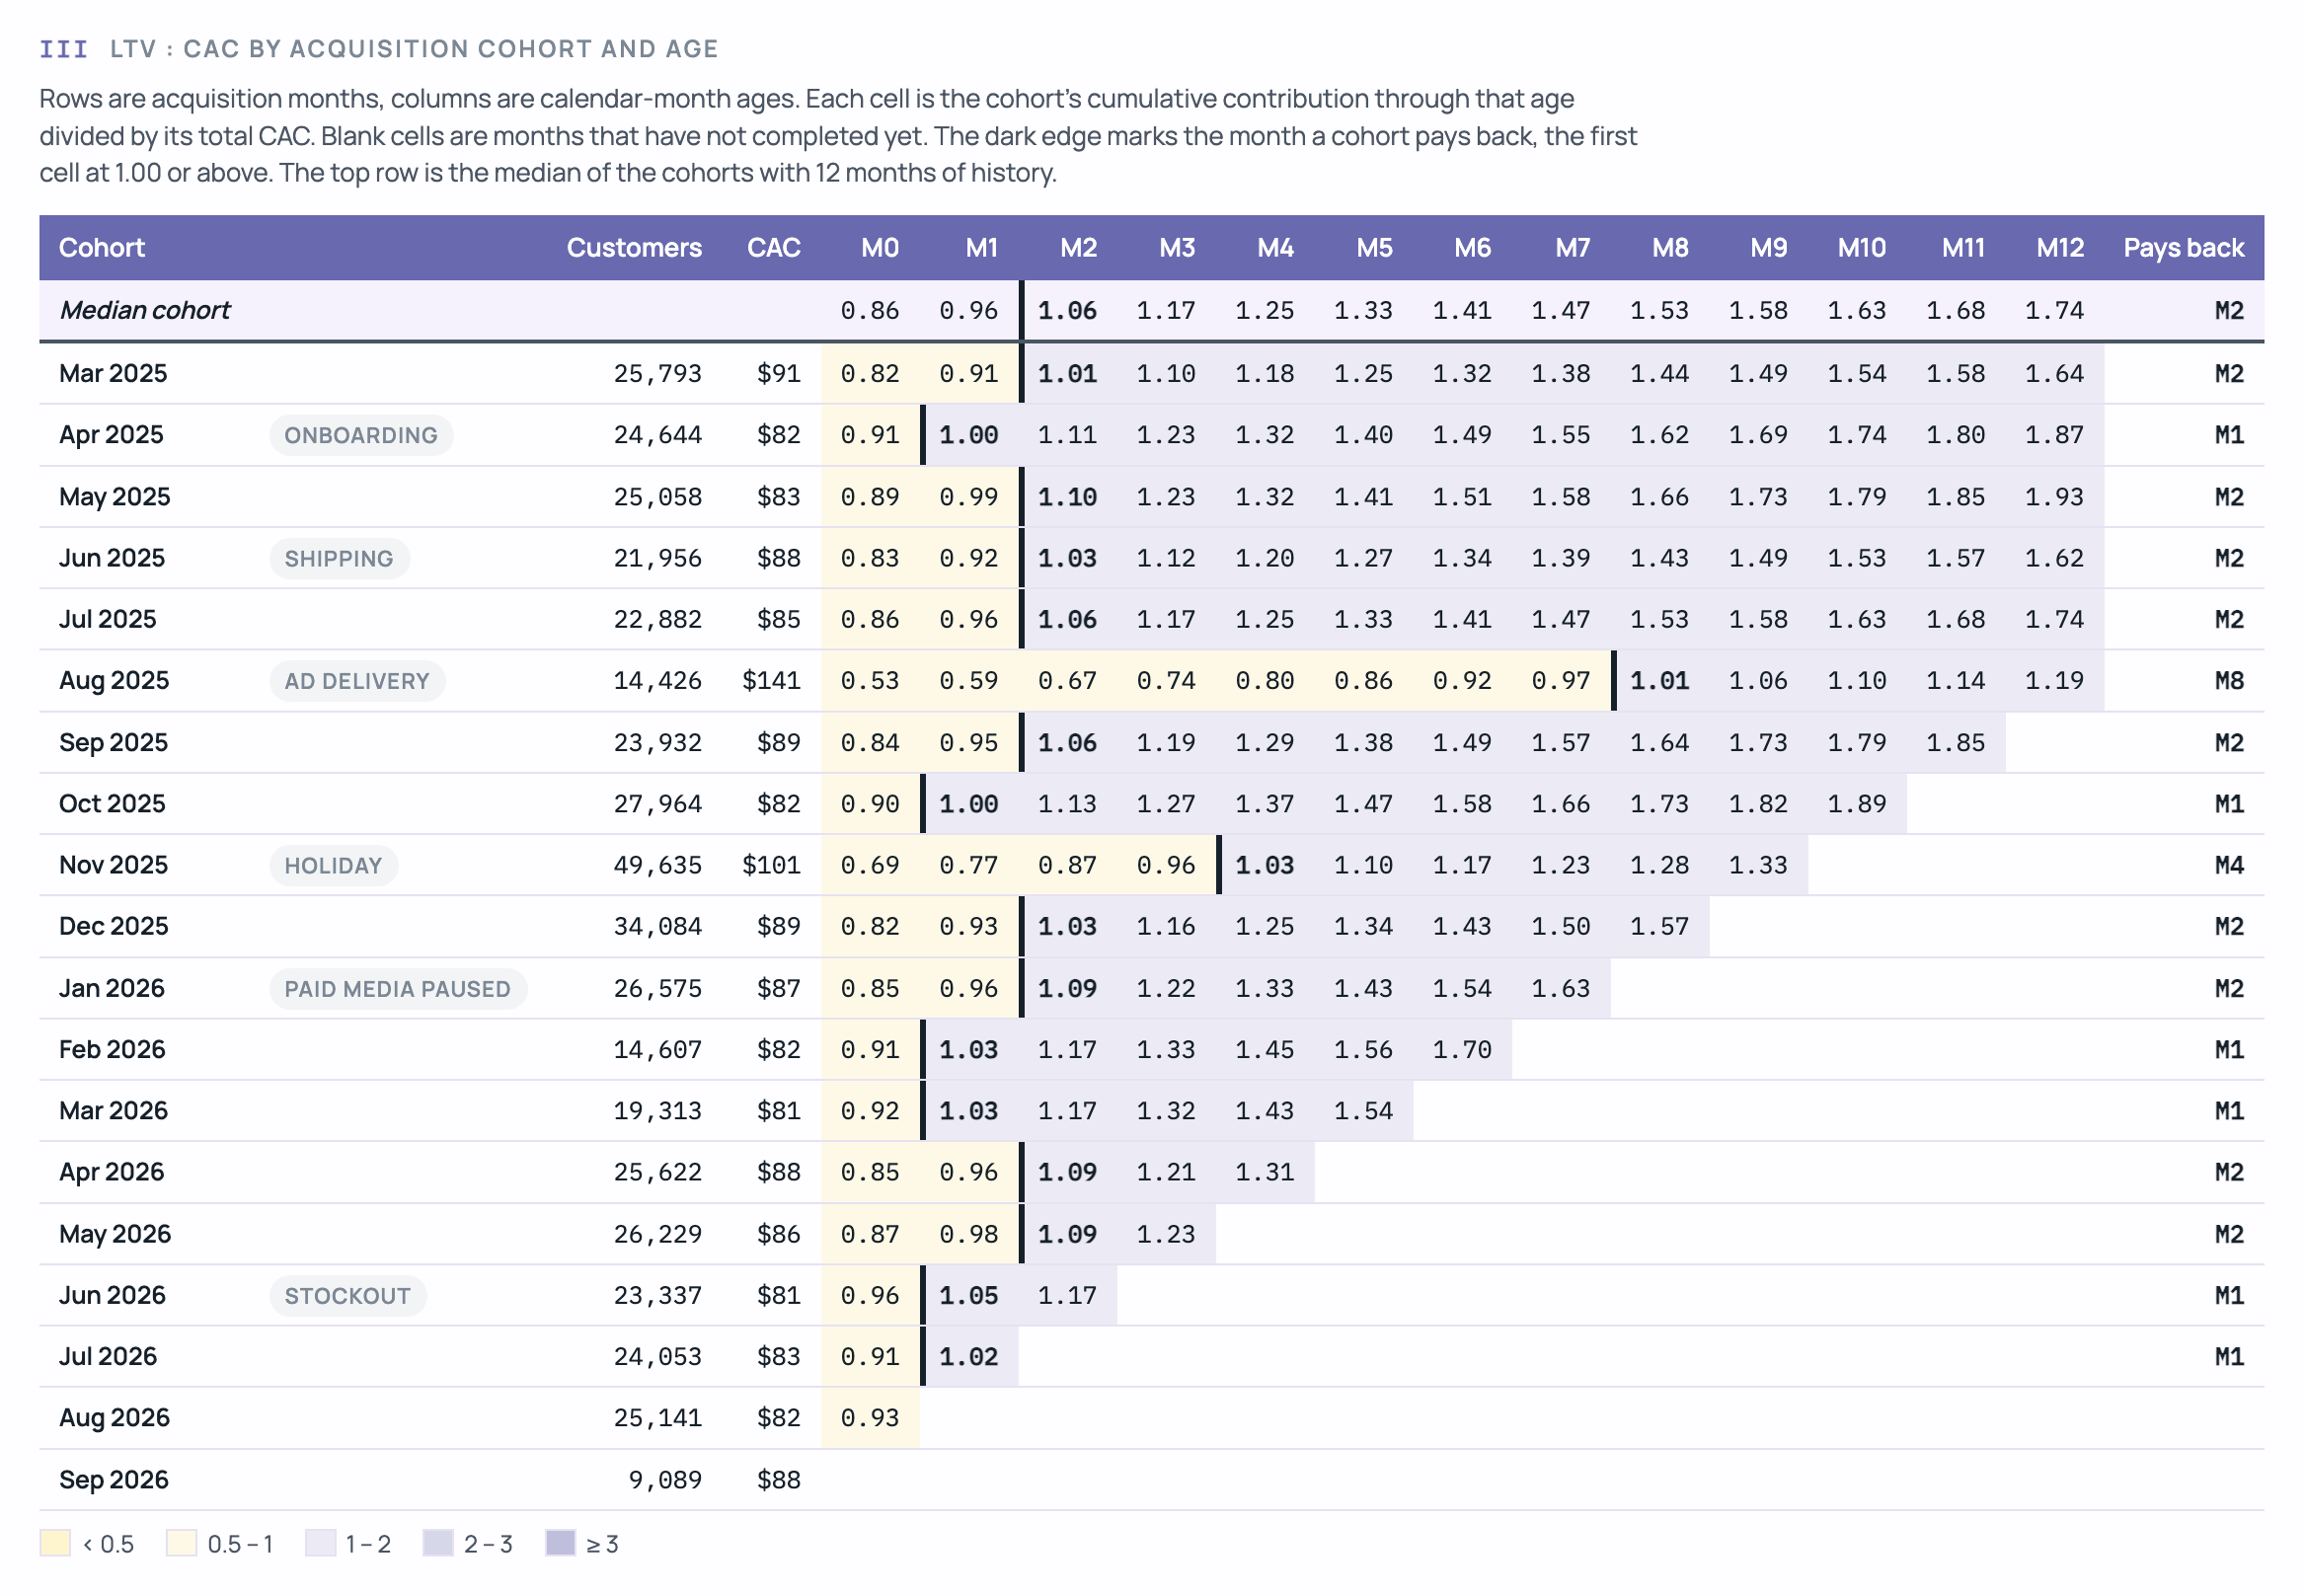
The result is a cohort table like the one above, built from your warehouse and refreshed every week. Tiny changes in the ratio have massive top-line and bottom-line consequences, which is where the budget conversation changes: marketing spend can be set from payback instead of from last year’s number.
If LTV:CAC consulting is something you’d like to apply to your retail brand, we’d love to talk more.