
We Evaluated 3 Media Mix Models (So You Didn’t Have To)

One of the most mind-bending trends in media in the last decade, has been the staggering proliferation of choice for marketers looking for platforms advertise on. To give some perspective on the scale of this choice, marketers can nowadays choose between over 50 aVOD platforms, 20 social networks selling ads, 33 different DSP’s, 50 OOH vendors, and well over 7,000 print magazines. And none of this taking into account one-off influencer campaigns, private placements, brand integrations, or event activations. There’s a lot of choice out there.
And with all that choice, comes the pressure of deciding not just WHICH platform to advertise on, but how to allocate your media spend across each one. The answer is certainly not ALL OF THE CHANNELS (not everyone can spend like they’re Procter & Gamble), and it’s certainly not ONE OF THE CHANNELS (most modern research bears out that being exposed to marketing on multiple channels is the most effective solution).
So how do you do it? How do you decide a) which channels are the right ones for you and b) how many dollars do you invest into each channel?
Turns out there’s a couple ways of solving this problem.
1) Multi Touch Attribution (MTA): Which assumes that you are omnipotent in your ability to see every impression and click that a customer goes through before a sale. And as walled gardens get increasingly more walled, there’s a growing sense that pure MTA is impossible.
2) Experimentation or “Incrementality”: Which assumes you have the guts to “hold back” ad impressions from a control group, in order to isolate the effect of marketing dollars on everybody else.
3) Media Mix Modeling (MMM): Which rightly assumes that you CAN’T see every impression and click before a sale, and instead take a statistical approach to proving the effect of ad spend. It basically attempts to answer: given some historical ad spend across marketing channels, and given some dollar amount of sales, how many dollars does each channel deserve credit for? This technique can be represented by the chart below, which shows $31M worth, where 16 channels *drove* that performance and 3 channels *dragged* on that performance.

Now fair warning, none of these techniques are particularly simple to implement. But it turns out that doing NONE of them is remarkably expensive. In fact, BCG estimates that companies developing these “necessary capabilities can expect to see a 20% to 40% improvement in spending efficiency and as much as a 10% increase in marketing effectiveness.”
And we don’t want to see you leaving money on the table.
It kills us inside.
Which is why we dug in and googled hard to explain this old-school dark-art called Media Mix Modeling, which has understandably come back into vogue in recent years. And we didn’t just find dreadfully complex whitepapers for you, or rambling 2-hour long youtube lectures, we found actual code that you can install and run on your laptop. Behold, the models...
SapientNitro - https://github.com/rkthakur/mediamixmodeling
ThirdLove - https://github.com/mecommerce/ThirdLove-Tech-Blog
Guang Fei - https://github.com/Guangfei0/Market-Mix-Modeling
SapientNitro
We don’t know who at Sapient created this github repository, but they did a bang up job. The repo includes a great overview of the theory of MMM, as well as a full-stack application that you can install yourself. It includes a MongoDB database, a Node.JS middle tier, and a D3 visualization layer on the front end. You can even customize which statistical model it runs, import your own historical media spend, and display the “report card” for each model. Someone did this work in their free time and we’re impressed.
If you wanted to stand up your own MMM offering and sell it to your customers, this is an excellent place to start!
By default, the code uses an “Ordinary Least Squared” technique to fit the data. By “fit” we mean: it examines your historical ad spend data, and finds the best algebraic function that predicts sales based on the spend.
If you were to spend on just one channel, the model would look like this:

An equation that can be visualized like this:

Or said in Pseudo-English:
Your Total Sales = A Constant Number + (Your Total Spend on Facebook * A Multiplier)
And said in Actual-English
The model predicts that if you spend $100 on Facebook, your Total Sales will be $100 times The Multiplier.
The statistical “fitting” process figures out what the Multiplier is for your data.
Ok, ready....?
And if you spend on multiple channels, the function would look like this:
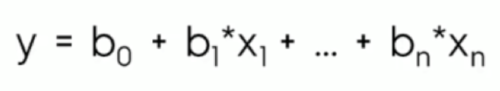
Note that there is no way to visualize multiple linear regressions past three variables, but here’s what three would look like:

This model described in Pseudo-English would be:
Your Total Sales = A Constant Number + (Your Total Spend on Facebook * A Multiplier) + (Your Total Spend on Google * A Multiplier) + (Your Total Spend on Television * A Multiplier)
And said in Actual-English
The model predicts that if you spend $100 on Facebook, $500 on Google and $100k on TV, your Total Sales will equal ($500 times The Google Multiplier) plus ($100 times The Facebook Multiplier) plus ($100 times The TV Multiplier)
The good news is, you don’t generally need to understand all the statistics to get all the benefit. The platform does the heavy lifting for you. But in the event that you do understand the statistics and want to change the underlying approach, all of the code is made available to you on github. It’s great. You can even upload your own data, and it’ll spit out the results for you:

ThirdLove
This one is awesome. The gold standard of MMM explainers, in our opinion. And believe us, there is a giant vacuum of resources about this subject, and this one comes with an outstanding primer on the general MMM playing field, and even includes (wait for it….) an iPython notebook that allows you to run the code in your browser in Google Colab. Technically speaking it uses the R language under the hood, but the notebook leverages the BSTS R library, and python’s ability to import and run R code.

The code is significantly more sophisticated than the Sapient one. And the ThirdLove blog (a VC-funded Direct-to-Consumer bra startup, of all places) is an extremely rich resource for pretty much any advanced Marketing Analytics topic. So instead of a simple “Ordinary Least Squared” approach (arguably the simplest form of linear regression) the ThirdLove strategy uses what’s called a Bayesian Structural Time Series (BSTS) Model. It’d be significantly more difficult to explain in the context of this article, but in short, the strategy also corrects for things like “seasonality” and external factors such as changes in the strength of the company or economic environment.
If you’re interested in knowing more about BSTS, there is a great article written by another VC-funded Direct-to-Consumer clothing company called Stitch Fix, in which they argue why they abandoned an ARIMA model in favor of a BSTS model (I know, right?!?). Here’s a great quote from the article:
“Yes, I’m talking about good old time series analysis, an ancient discipline that hasn’t received the cool “data science” rebranding enjoyed by many other areas of analytics.”
In any case, the ThirdLove code also provides a significantly more advanced “report card” on how the model performs, including a method to backtest it against data it hasn’t seen yet. Think of backtesting as a way of evaluating your Blackjack strategy before placing a million dollars of Las Vegas bets against the strategy. It’s really nice, and regardless of what level of what level of sophistication you’re at, the ThirdLove article is a great learn.
Guang Fei
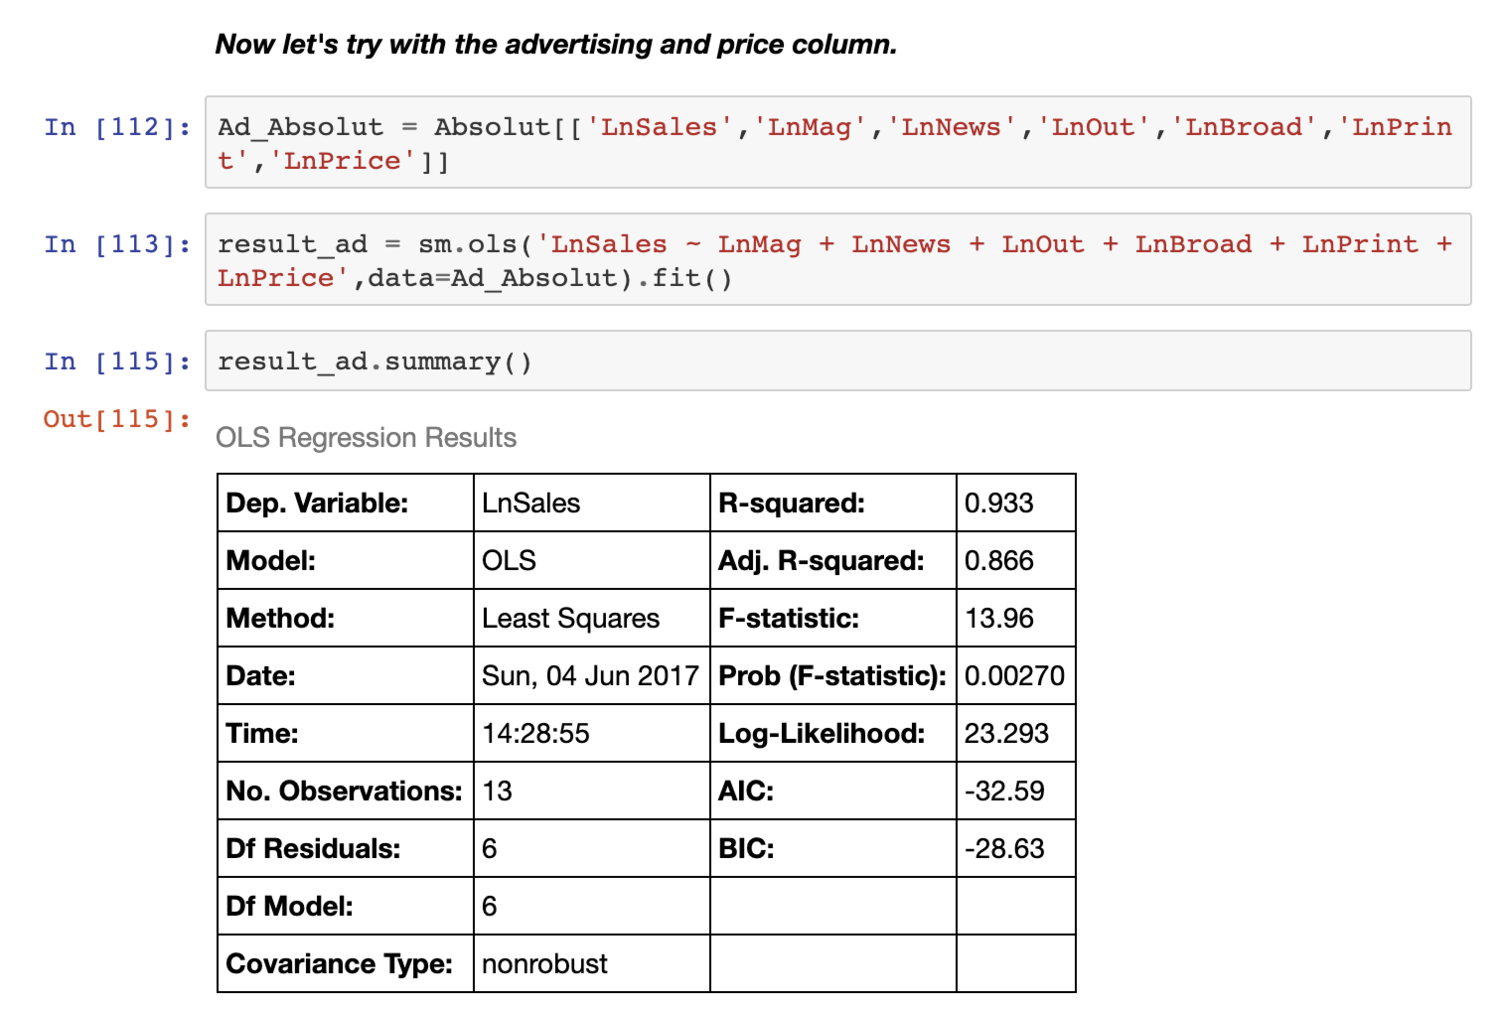
If your appetite for going deep on MMM is relatively small and you’re just getting started with statistics, this github repository is a great place to start. Stats is a steep climb and this resource includes probably the simplest possible sample code. It includes a primer that you can just read without having to install or run any code.
They literally go step-by-step, and even walk you through the sometimes difficult-to-interpret stats “report card” scores that get spit out at the end of building a model:
In general, we’re very excited about this area. And since GDPR - and the ensuing death of 3rd party cookies - is going to render true Multi Touch Attribution impossible, Media Mix Modeling is a great substitute.
Many of the big media players out there have some excellent additional resources if you’re interested in digging deeper. Netflix and Facebook go considerably deeper and address some of the challenges you’ll inevitably run into give that the rate of innovation often renders many simple MMM approaches useless. Said another way, Facebook improves their platforms almost daily, so building models on data from even a few months ago may be compromised by platform updates.
Lastly if this is an area you’re looking to embark on, please reach out to us. We’d be eager to help get your team set up correctly and go on this journey with you together.
Thanks so much for reading!